- Knowledge Base
- Product Features
How to install Trakka Inspect
Step by step guide of how to install the Trakka Inspect application
|
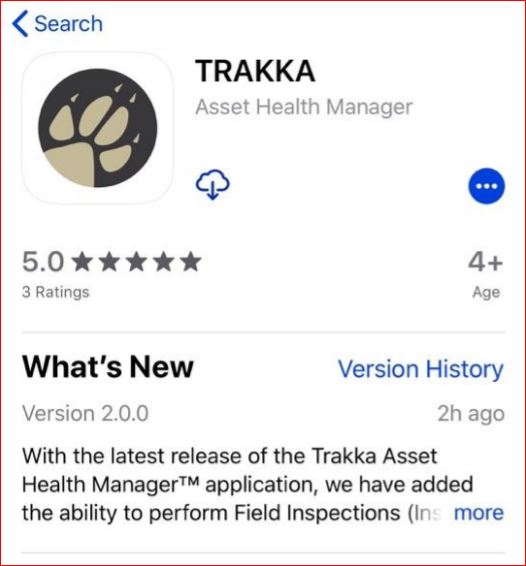
DOWNLOAD THE APP Search for the “Trakka” App in the Apple App store or Google Play store and download it to your device. Once installed, click on the Trakka app. |
 |
|
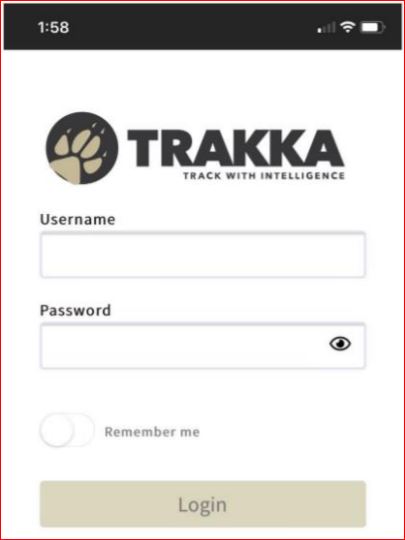
ENTER YOUR LOGIN INFORMATION Log in using your Trakka username and password.
Note that if you select Logout from the Menu it will clear your credentials, this will allow a different user to use the app with their credentials. |
 |
|
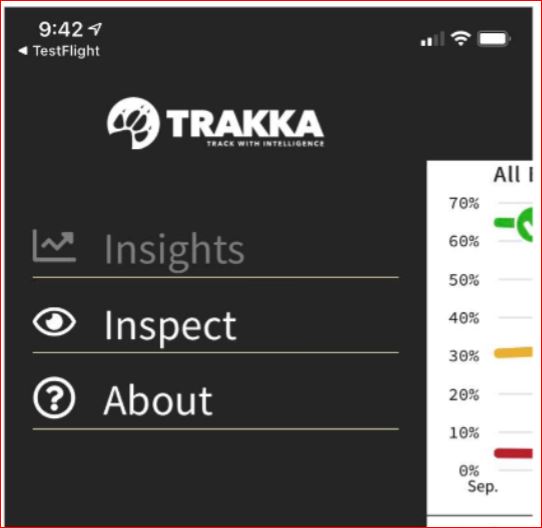
SELECT THE INSPECT MODULE After logging in, use the Menu item on the bottom left to access the navigation menu. To perform inspections, choose the Inspect option. |
 |
|
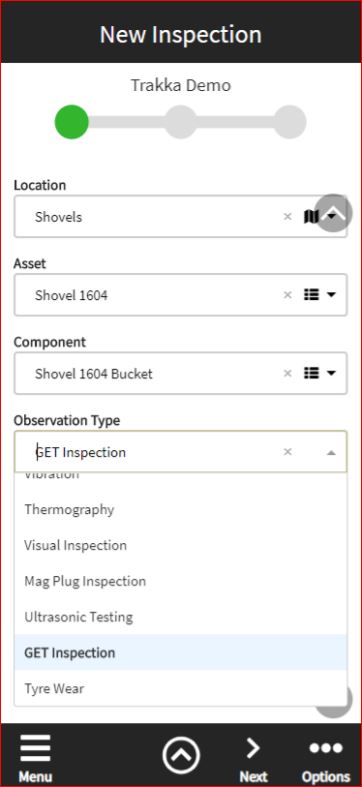
SELECT THE COMPONENT AND OBSERVATION TYPE The first screen of a new inspection record is for entering information about the Asset and Component being inspected as well as the observation type for the data being collected. You must complete all fields before you can move to the next screen: |
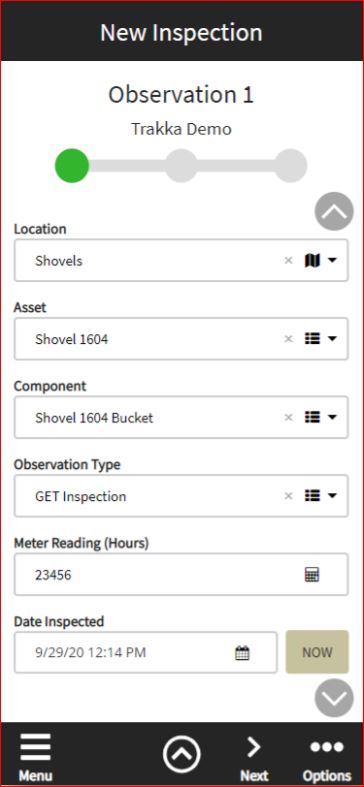 |
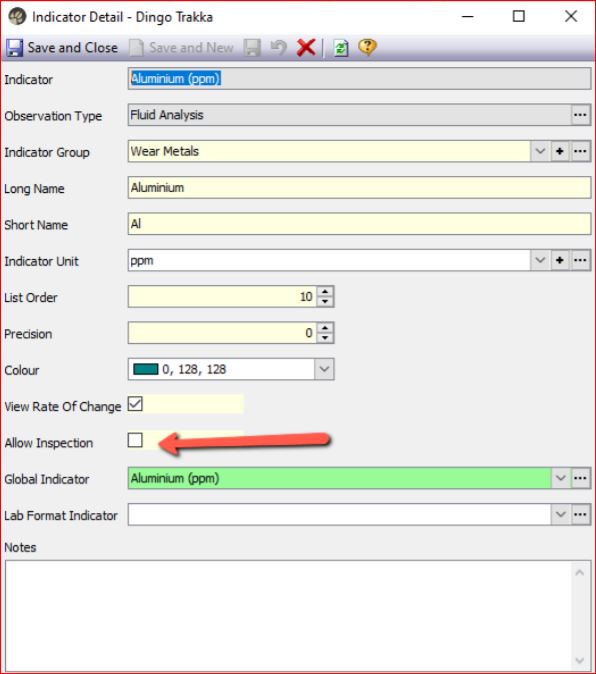
| SELECT THE OBSERVATION TYPE Use the drop down to select the Observation Type you are collecting data for. It is possible to perform multiple inspections and you will come back to this screen for any other inspections performed on this asset Observation types available for all components • Filter Inspection – Inspection of filter media. • Visual Inspection – Any type of visual inspection, not specifically for filter media or magnetic plugs. • Mag Plug Inspection – Inspection of magnetic plugs. Other Observation types could be available in this dropdown, it depends what Observation Types have been activated for the site. If you don’t see the Observation type you need, contact your Trakka administrator. Examples of other Observation types and their uses; • GET Inspection – Inspection of ground engaging tools such as dozer blades, bucket teeth, undercarriages etc • Thermography – Any type of inspection that captures temperature readings • Ultrasonic Testing – any inspections using ultrasonic measurement tools, such as truck tray/bed thickness, liner thickness etc • Tyre Wear – measurement of tyre tread depth/thickness Trakka can be setup to accept any time series data, and Observation types can be used to group that data. To make an Indicator available in the app for data collection, ensure the “Allow Inspection” checkbox is ON in Trakka. This can be located in Profiles & Lists > Indicators > Indicator detail form |
|
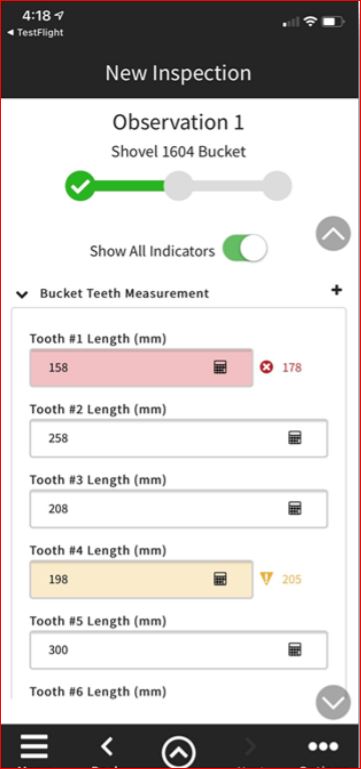
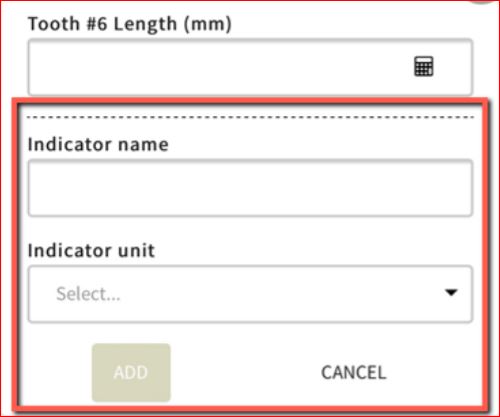
CAPTURE ANY DATA MEASUREMENTS This next screen is for entering the Inspection measurement details and contextual information for this Observation. Show All Indicators – This toggle will change the list of Indicators that are displayed. • OFF – only indicators for that observation type and the component profile will be listed. This helps focus the list to what is usually collected for that type of component • ON – all indicators on the site for that observation type will be listed. This is useful when thinking about adding a new indicator, you can check the list of existing indicators to see if it already exists. Indicator value field – there are a number of features of the field that measurements are entered for each indicator; • Last Value - If the device is online (connected to internet) then the app will retrieve the most recent value for each indicator listed and display in faded italic font. This helps the inspector see what the last collected value was. Once you start typing the value disappears • Trakka alerts – Trakka alerts are available on the device and each entered value is compared to those alerts and if a limit is reached, the field will change color and the alert value will be shown to the right of the field Indicator Groups – each list of Indicators is stored within an Indicator Group (same concept as Trakka). These groups can be expanded or closed using the control to the left of the indicator group name. Tap the + icon to the right of the indicator group name to add a New indicator to that group. This will open 2 new fields that allow the user to add a New indicator for the inspection, that will be sent to Trakka when submitted. • Indicator Name – this is the name for the Indicator as it will be displayed in Trakka and the App in the future. There is validation logic in the background to try and avoid duplicating existing Indicator names • Indicator Unit – this is a dropdown list of existing Indicator units from Trakka. ©2022 DINGO Software Pty. Ltd. |
|
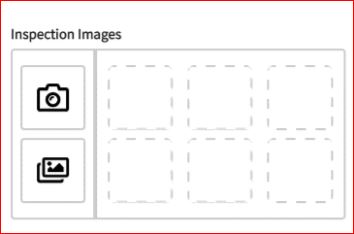
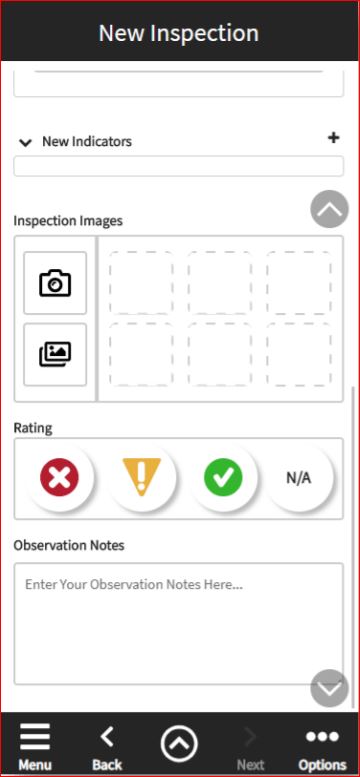
COMPLETE THE INSPECTION RECORD Once all the data measurements have been captured (if applicable) use the fast scroll buttons to navigate to the bottom of the page to complete the inspection record by capturing any images, adding an inspection rating and recording any notes. Inspection Images – Tap the appropriate icon to either take a new photo using the camera or select a previously captured photo that is in the camera roll. See below for more detail. Rating – Select the correct observation rating. See below for more detail. Observation Notes – Enter notes related to this observation. Once all fields have valid entries, you can either tap the Next arrow in the footer to advance to the next page to submit the observation/s, or tap the Quick Access Menu and choose Add Observation button to add another component observation for the current asset inspection. |
 |
|
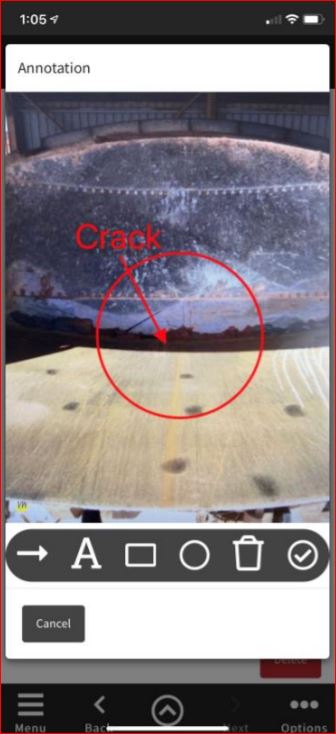
ATTACH THE INSPECTION IMAGES(S)
The following annotations can be added from the Annotation window; |
|
|
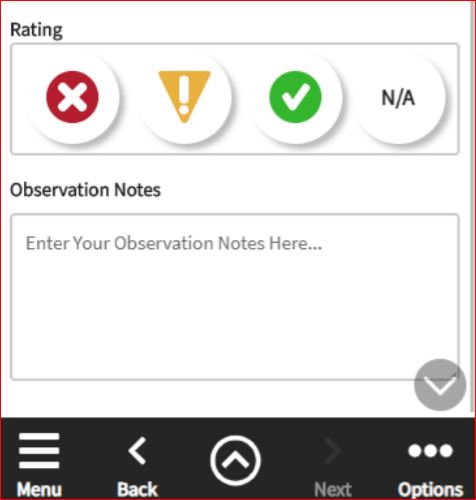
SELECT THE OBSERVATION RATING N/A can be selected if: • The inspection is not possible due to the position of the component. • Operator is not available to place equipment in correct position. • It is not safe to inspect the equipment based on risk assessment. |
 |
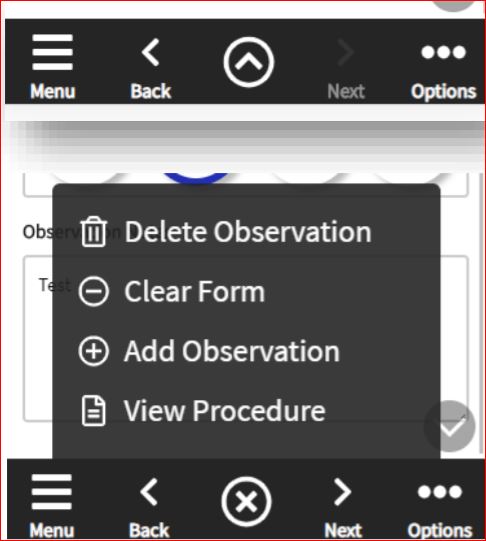
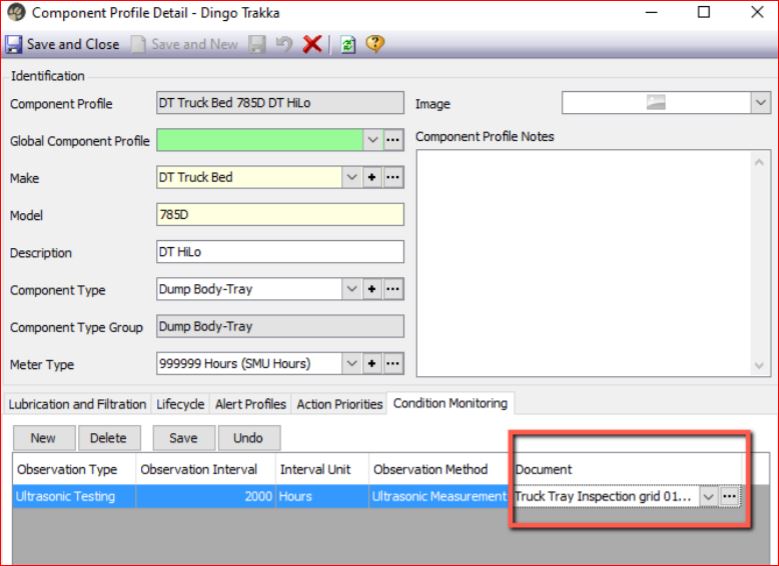
| QUICK ACCESS MENU The Quick Access menu is available at the bottom of each screen (up arrow to the right of Back). It is used to access context specific options as per below • Delete Observation - If you want to delete the current observation you are creating, tap the Delete Observation option • Clear Form – This will clear the contents of the current screen so you can start again • Add Observation – From screen 2, you can choose to add another observation for the same Asset & Component • View Procedure – if the currently selected Component has an inspection procedure document linked in the Component Profile screen in Trakka, it is viewable in the app by using this option. If the menu item is greyed out it means no document is available for this component and observation type. Procedure documents can be added in Trakka in the Component Profile detail form in Trakka. In the Condition Monitoring tab, create a row record for the Observation type and add the procedure in the Document field. |
|
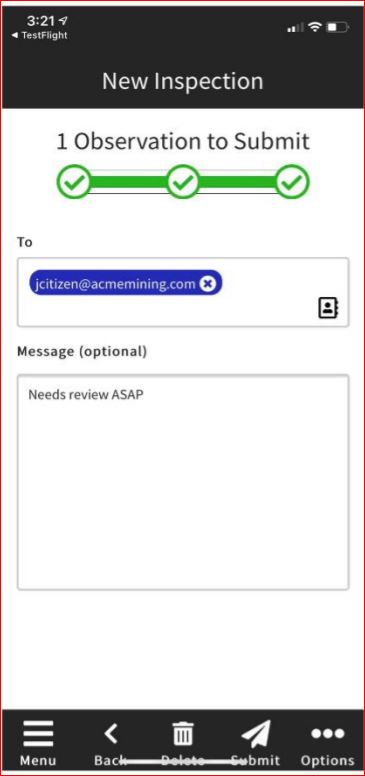
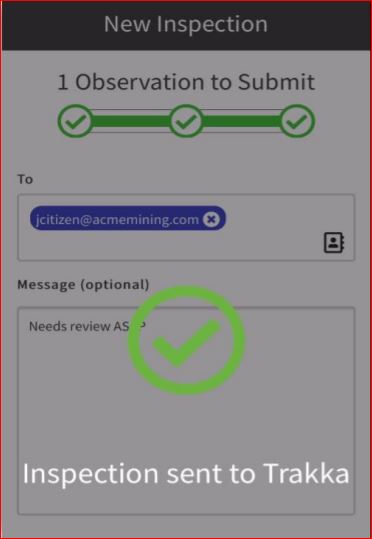
SUBMIT THE OBSERVATION(S) Once all Observations have been completed for the Inspection, they can be submitted to Trakka. To – This field is prepopulated with the distribution list recorded in Trakka. This list is maintained on the Asset record in Trakka on the Inspection App Linked Persons tab. Each person can select which Ratings they want to receive emails for by configuring their selection In Profiles & Lists > Persons Responsible You can also type in additional email addresses or select them from the devices contact list. Any email address recorded here will receive a HTML email report of the inspection details. 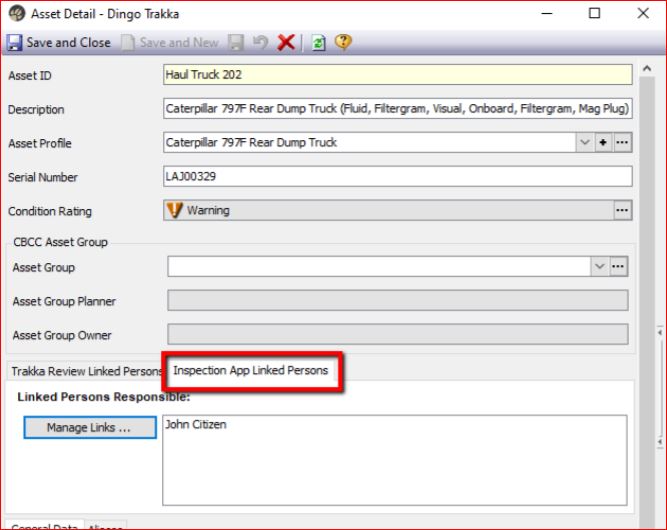 Message – Add any additional messages that you want to appear on the HTML email report. If you need to go back and edit anything, use the Back button at the bottom of the screen. Once everything is ready, submit the observation/s by tapping the Submit button. Once the Inspection is successfully processed, you will see a message noting that Inspections were sent to Trakka. ©2022 DINGO Software Pty. Ltd. |
|
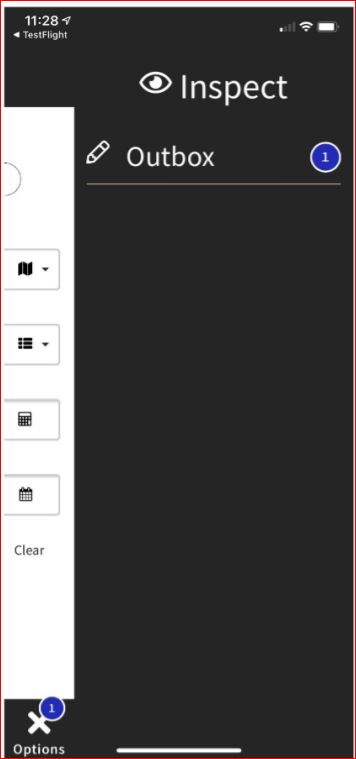
| OPTIONS Submitted Inspections are sent via the Outbox. The Outbox can be found under the Options menu (bottom right corner). You can see the progress of Inspection submissions by going to the Outbox where the number of observations are shown in a blue circle. Once the app is connected to the internet, it will send the Inspections to Trakka immediately and the records in the Outbox will be cleared. 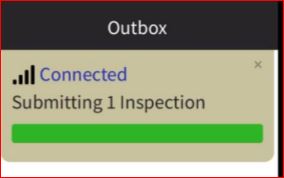 |
 |
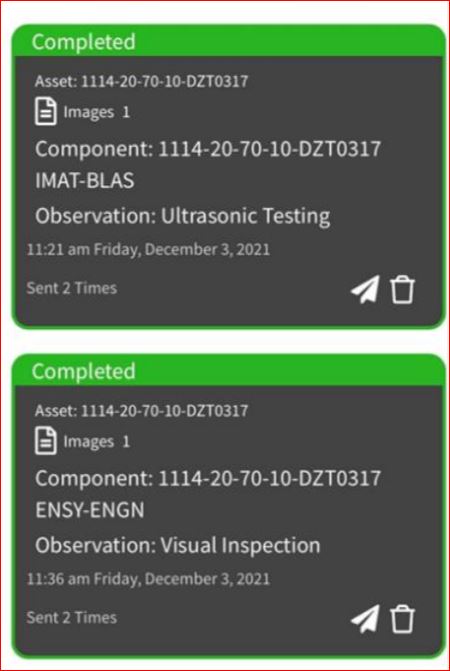
| OUTBOX Submitted Inspections are saved in the Outbox for 7 days, in case there are communication/transmission issues For more information on Dingo's industry leading predictive maintenance solutions, email us at info@dingo.com or use our contact form on DINGO.com |
 |